Workshop prepared for the Structural Basis of Pharmacology:
Deeper Understanding of Drug Discovery through Crystallography Meeting
Erice June 2014

1. Introduction
-
This tutorial is a basic tutorial for non-protein crystallographers who are interested in ligands. It is written by someone how once did computational modeling and molecular dynamics. If the tutorial convinces any modelers to look at electron density when working on a project I will be happy!
-
It aims to give a gentle introduction and to encourage users of protein structures to examine electron density and to understand how ligand fitting works. The learning objectives are:
-
To know how to run Coot.
-
To be able to retrieve models and maps from the EDS server within Coot.
-
Master basic Coot use, specifically:
-
How to center on a ligand.
-
How to rotate and translate.
-
How to turn the display maps on and off.
-
How to alter the map contour level.
-
How to measure distances, angles and torsions.
-
-
How to generate a restraint dictionary for a given ligand at the Grade Web Server
-
How to use Coot to perform real space refinement of the ligand
-
To understand the difference between real space and reciprocal space refinement.
-
To use Coot to examine the results of a BUSTER re-refinement (that has been already run for you).
-
Examining ligand chemistry before and after BUSTER refinement using buster-report (once again already run).
-
Have a go at fitting ligands into difference density.
-
-
The tutorial will not cover how to actually run BUSTER refinements. If you want to learn to do this use the Intermediate Tutorial (afterwards).
-
It should be possible to work through most of this tutorial on windows using wincoot on a windows PC.
|
|
BUSTER must be run using Linux or OSX as there is no windows version. |
-
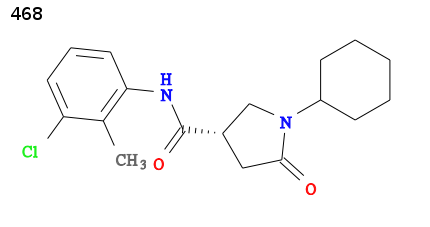
For an example we will use 2h7p the structure of TB enoyl reductase, solved in 2006 by Bob Stroud and co-workers at UCSF, see 2h7p RCSB. The enoyl reductase has been solved in complex with a pyrrolidine carboxamide inhibitor:
-
The ligand has been assigned the PDB three letter code 468 for full details visit http://ligand-expo.rcsb.org/reports/4/468/
-
The structure was solved with data to a resolution 1.86Å and has particularly clear ED for the ligand. Examining and correcting the ligand’s chemistry provides several interesting lessons. For more background see the accompanying Book chapter and Presentation.
2. Basic Coot use
Coot is the program used by practically all protein crystallographers to view and model build structures. The first paper describing it has been cited in over 10 000 publications. It is a great tool to use and is quite easy to learn. It is a great idea for those working the protein X-ray structures to have some familiarity with it.
2.1. Installing Coot
-
The most convenient way to install Coot is with the CCP4 package. Easy to install bundles for Linux, OSX and Windows are available from http://www.ccp4.ac.uk/.
-
The CCP4 version will work find but if you want the latest features then:
-
For Linux use Paul Emsley’s coot home page
-
For windows use wincoot
-
2.2. Running Coot
-
to run Coot either:
-
click on the Coot (or wincoot) icon.
-
or if using Linux type coot at the command prompt
coot
-
-
Note that coot is much easier to run using a three button wheel mouse. If you are working on a laptop then borrow one if possible.
-
Print out Paul’s Coot crib sheet (unless you have just been given one).
2.3. Retrieving PDB model and EDS map in Coot
-
The EDS server http://eds.bmc.uu.se/ provides electron density (ED) maps calculated with REFMAC. Coot has a really useful feature facility to directly download a PDB model and the corresponding ED maps directly from EDS. In Coot select menu option File → Fetch PDB & Map using EDS … and enter 2h7p in the PDB accession code popup dialog box.
-
If there is a network access problem:
-
Download pdb2h7p.ent and load using coot menu option File → Open Coordinates…
-
Download 2h7p_sigmaa.mtz and load using Coot menu option File → Auto Open MTZ…
-
-
Click /Yes/ in the Fix nomenclature errors dialog box.
-
you should now see the protein and ED maps loaded.
-
2.4. Controlling the view in Coot
-
The 3D view is controlled in Coot done by using the mouse. The procedure is to click a button and dragging the mouse up/down or left right. Different movements are produced if you press and hold either the Shift or Ctrl key while moving the mouse. This is easier than it sounds and one soon gets used to it!
-
Look at the Coot crib sheet, then practice:
-
rotating the view (click and drag left mouse button)
-
translating the view (hold Control key and then drag left mouse button).
-
zooming in and out (drag right mouse button).
-
changing the slab. (hold Control and drag right mouse button).
-
labeling atoms (hold Shift key then left mouse button click on the atom).
-
recentering on an atom (middle mouse button click on atom).
-
changing the contour level with the middle mouse wheel (if you have one).
-
|
|
What if you have lost your Coot crib sheet? Do not worry simply use the Coot menu option About → Hints … to see a list of the different actions/motions. |
2.5. Centering on a ligand
-
We are interested in the 468 ligand and hunting around for it is a pain. Coot provides a great way to do this. Click on the molecule icon on the top action menu:
This is the Go To (Next) Ligand button.-
What happens? Try labeling an atom near the center of the screen.
-
-
There are two ligands in 2h7p the first one if the NAD cofactor. To center on 468 hit the Go To (Next) Ligand button again.
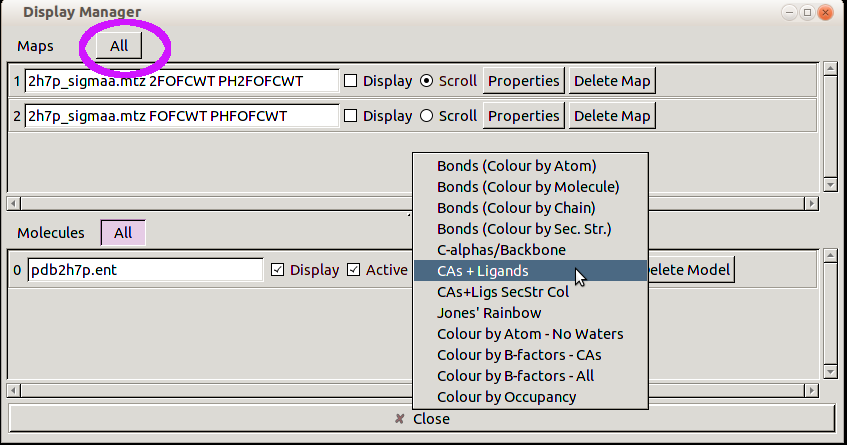
2.6. The Display Manager
-
The view is still rather complicated, it would help if one could turn the maps off for a bit and not display all the protein atoms. This can be done using the Display Manager dialog box. Open this by clicking on the Display Manager item on the top action menu:
-
You will see a list of the currently loaded Maps and Molecules. Click on the /All/ button next to Maps and: set the scroll menu to CAs plus Ligands:
-
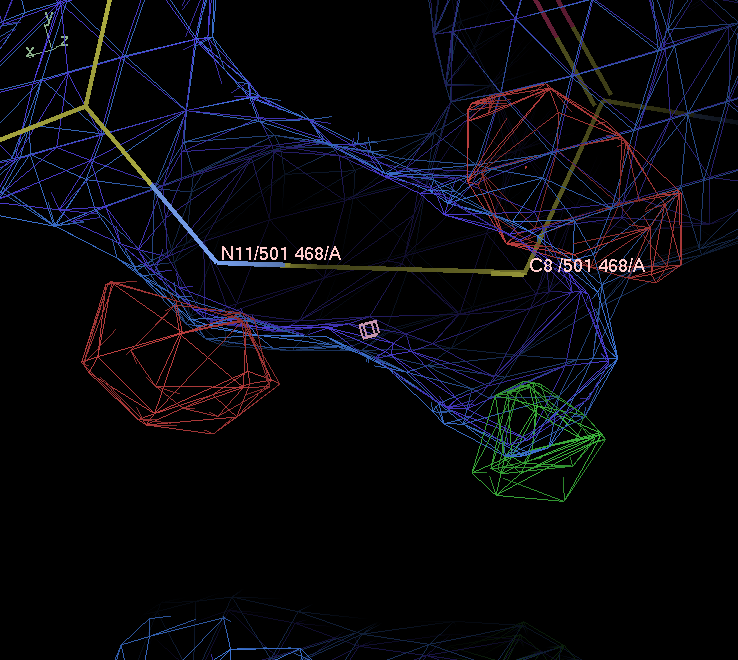
You should now see two ligands with no maps. Look at the 468 ligand.
-
There is a five-membered 5-oxopyrrolidine ring in the ligand Question: what geometry does this ring have in the structure? Given that atoms C8 C9 and C10 in the ring are sp3 tetrahedral carbons would you expect this to be reasonable?
-
Also look at the geometry of the amide bond and cyclohexyl group.
-
2.7. Looking at electron density maps.
-
ED maps are as important as the model. We normally look at two maps.
-
The 2Fo-Fc map indicates where the X-ray scattering electrons are (according to structure factors and current model). It is normal to color this blue or grey.
-
Fo-Fc difference map:
green for positive difference: where the current model fails to place sufficient electrons
red for negative difference: where the current model places too many electrons
-
-
This means that when a ligand, protein side chain or water molecule is well placed in good density we hope to see the atoms surrounded by and placed centrally in the 2Fo-Fc map. In addition there should be little or no difference density.
-
An ED map is a measure of how many electrons per Å3 in three dimensions. A such we do not directly view the map but instead look at a contour isosurface. This the 3D analogy of a contour line on 2D topographic maps (where you have a "700m height contour" that connects points at the same height). For ED maps it is normal to describe the contour level in rmsd (also know as sigma) rather than absolute electrons per Å3.
-
You can easily control the contour level used for a map in Coot. Use the Display Manager to display 2Fo-Fc by clicking on the tick box for the "2FOFCWT PH2FOFCW" map.
-
Now use the mouse wheel to adjust the contour level of the 2Fo-Fc map (or use the keyboard + and - keys). Adjust the contour level to 3.0 rmsd. Question: Which atoms and groups on the 468 ligand have the strongest ED? Why? (Hint: if the ligand had a Br atom in place of the Cl atom it would have even stronger ED).
-
Adjust the map contour level down to 1.3 rmsd (my preference for a default contour level to look at 2Fo-Fc). Does the 5 membered ring sit centrally within the ED? hint look at atom C8
-
The five membered ring is not centered in the ligand’s electron density:
3. buster-report output for 2h7p.pdb
-
BUSTER is a reciprocal space refinement program. I have run a BUSTER refine job to show what results can be obtained with a MapOnly run where BUSTER is used to produce ED maps for 2h7p.pdb without moving an atoms (roughly repeating what EDS does but using BUSTER rather than REFMAC). As an initial step I used the BUSTER suite tool hydrogenate to add hydrogen atoms to the ligand and protein as we recommend to do done for high resolution <2.0Å structures.
|
|
This tutorial does not show how to actually run BUSTER refinements. If you want to learn to do this use the Intermediate Tutorial (afterwards). For the commands run here see 2h7p Tutorial BUSTER commands run. |
-
The buster-report tool provides an analysis for BUSTER refine results together with presenting useful analysis by MolProbity (for protein geometry) and Mogul (for ligand geometry). Look at the buster-report for MapOnly run on 2h7p It is best if you right click on link and select "Open Link in New Tab" so you can switch between pages
-
Note that you can download the mtz file from the main page.
-
If you have plenty of time download the mtz and open tin Coot using menu option File → Auto Open MTZ … compare the EDS (REFMAC) maps with BUSTER for the ligand. The BUSTER maps may be slightly cleaner/clearer but in this case the maps are so clear there is not much to choose between them.
-
Follow the Ligand analysis link at the bottom of the page.
-
The page includes an animated gif of the ED around each ligand (produced with PyMOL).

The animated gif is my take on old-style stereo pictures. It uses a limited rotation around the y-axis to enable some appreciation of 3D. Here you can see the difference density near the five-membered ring: the nitrogen atom would like to go up the page and the CH2 atom would like to go down. The difference density on the amide suggests that it would like to be flatter.
-
-
The mogul analysis shows that there are a great many bond lengths and bond angles in the ligand that differ from what would be expected based on similar CSD structures. The ring puckers for both the 5-membered and six membered rings are unusual. The buster-report results give a quick way to get the information on geometry and map fits that we obtained by looking in Coot.
-
How can the ligand be improved? To do this we need to adjust the geometry of the ligand to better fit the ED and to have better geometry. This can be done by using refinement. But something is necessary first.
4. Using the Grade Web Server to generate a restraint dictionary for the ligand
-
In protein structure refinement it is essential to impose restraints to keep the bond lengths, bond angles, planes and torsion angles within chemically reasonable values. This is normally done by using a restraint dictionary. The CIF format for dictionaries has become the standard and the same restraint dictionaries can be used in Coot, BUSTER, REFMAC, PHENIX …
-
The Global Phasing Tool to generate restraint dictionaries is grade. This uses CCDC Mogul combined with simple QM methods to obtain information like ideal bond lengths, ideal bond angles and where planes are. This information is then used to create a CIF restraint dictionary. grade is supplied with BUSTER but if you want to use it independently for non-confidential ligands then the Grade Web Server provides an easy-to-use installation-free facility.
-
Visit the Grade Web Server http://grade.globalphasing.org and create a dictionary for PDB chemical component 486 (the ligand in 2h7p). Using the server should be fairly self-explanatory.
-
In case of internet connection problems then visit saved local copy of Grade Web Server 486 results page
-
download the CIF restraint dictionary from your Grade Web Server run or from 468.grade_PDB_ligand.cif.
5. Coot real space refinement
-
Load 468.grade_PDB_ligand.cif by using Coot option File → Import CIF dictionary…
-
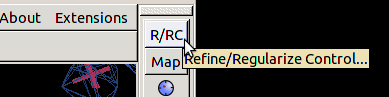
First click on the R/RC box:
Then click the Use Torsion Restraints tick box when using Grade dictionaries. This is because grade produces torsion restraints that are meant to be taken seriously (for instance in amide groups). -
Then click on the Real Space Refine Zone buttom:
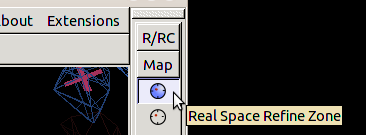
and double click on any atom in the 468 ligand You will see a ghost image of the ligand that is distorted to better fit the ED and to satisfy the grade restraints. At the end of real space refinement you will be presented with a traffic light box indicating whether there are any distorted restraints:

do not click Accept yet instead left click on any atom in 468 and drag it away the original position a little. Release the mouse button. You will notice that the ligand jumps back to the refined conformation. Now repeat the drag but drag the molecule so that it gets into protein density. You will notice that the molecule refines into a really silly conformation and that the traffic light is no longer green (restraints are distorted). This drag and drop Coot feature is great for building molecules into density. -
Reject any silly conformation and then real space 468 without mucking up the really sensible initial refinement. Look at what happens to the 5-membered ring, amide group and cyclohexyl ring.
6. BUSTER re-refinement of 2h7p.pdb
-
Real space refinement is a really useful tool for improving building and improving macromolecules by better fitting ED maps. But reciprocal space refinement needs to be used to finally adjust the atomic coordinates, temperature factors and (sometimes) occupancies to better fit the measured X-ray data (as converted to structure factors). This kind of refinement also needs restraints. As part of the refinement process new ED maps are produced. As the model is improved to better represent the data (as monitored by Rfree) the maps will progressively improve and new features will become obvious that in turn will allow a better model to be built. Therefore there is normally a cycle of model building in Coot using real space methods followed by reciprocal space refinement.
-
BUSTER is the Global Phasing tool for refinement. There are other choices for instance REFMAC (CCP4) and phenix.refine
|
|
This tutorial does not show how to actually run BUSTER refinements. If you want to learn to do this use the Intermediate Tutorial (afterwards). For the commands run here see 2h7p Tutorial BUSTER commands run. |
-
Look at the buster-report for re-refinement run on 2h7p its best if you right click on link and select "Open Link in New Tab" so you can switch between pages
-
Download the PDB coordinates and MTZ and open them in Coot. For the MTZ use Coot option File → Auto Open MTZ … You will notice that the ligand now fits the ED well and that the difference map features have disappeared.
-
Follow the Ligand analysis link from the bottom of the buster-report main page. The ED is shown to be cleaned up

-
In addition Mogul shows that all the conformational features analyzed are now within expected values from CSD. The dihedrals and ring scores provide a useful valid metric.
-
7. Producing a picture from Coot.
-
Although Coot is not dedicated to producing "pretty pictures" quite reasonable results can be obtained.
-
When producing images with ED it is really important to brighten the maps. This is particularly true of blue 2Fo-Fc maps when you want to project the image in powerpoint as blue projects badly. By default Coot uses variable brightness to enhance the 3D effects. So before you draw the image select option Extensions → Maps → Brighten Maps …
-
Always turn off any atom labels. Select option Measures → Clear atom labels . If you want to add labels do it in PowerPoint or whatever.
-
If you want to include an image in a document to print then use a white background select option
-
Then rotate and translate the view to get a good view.
-
And then use Draw → Screenshot → Simple … to save the image
-
|
|
For producing publication quality images then PyMOL or ccp4mg are preferable |
8. Fitting initial difference density.
-
Of course when a crystallographer is solving a ligand complex structure there will be no ligand placed into the initial difference density obtained after refining the MR solution.
-
To give you an idea of what is involved in fitting a ligand into initial difference density I have removed 468 from the refined structure and calculated a difference map.
-
Download 02_apo_MapOnly.pdb and 02_apo_MapOnly.mtz
-
Start a new Coot program and load the PDB and MTZ. Also import the grade 468 restraint dictionary.
-
Center on the ED for the ligand using Coot option Validate → Unmodelled blobs… There is one Blob.
-
Turn off display of the protein 2Fo-Fc map and tell Coot to fit to the Fo-Fc using the Map button.
-
Then let place 486 ideal coordinates into roughly the right area.
-
Use Extensions → Modelling → Monomer from Dictionary type in 468
-
Use real space refinement and Rotate/Translate Zone/Molecule to fit the molecule
-
How well can you do? Compare your fit to 2h7p.
-
Automated fitting tools can save some work for big molecules. See rhofit wiki page
|
|
Page by Oliver Smart original version May 2014. Revised April 2015. Address problems, corrections and clarifications to buster-develop@globalphasing.com |